
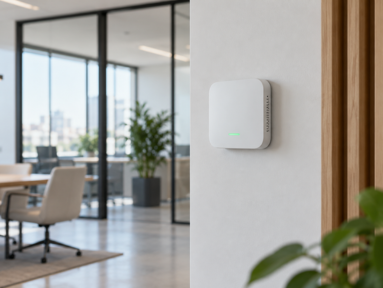
A monitoring deployment produces a reading every few minutes, for every sensor, indefinitely. Within a few weeks, that is a large volume of data and, in many buildings, no change in how anything is operated. The dashboard gets checked when there is a complaint and otherwise sits unopened.
This article is written for facilities managers and engineering teams who already have monitoring in place, or are specifying it, and want it to produce decisions rather than charts. It covers why alert logic has to be built on averaging windows rather than raw thresholds, what each parameter should actually trigger and who should act on it, and how the data feeds maintenance scheduling and budget cases. It assumes you have the data and are deciding what to do with it.
The sensors report instants; the framework is written in averages
This is the mismatch behind most unused dashboards.
Dubai Municipality’s technical guidelines for indoor air quality set out acceptable levels almost entirely as time-weighted figures. Carbon dioxide appears as an eight-hour average for existing buildings, with a separate ceiling value. Particulate matter appears as a 24-hour figure with a shorter-period figure alongside it. Relative humidity is given as a band rather than a point.
A continuous sensor does not report in those terms. It reports now. Two consequences follow, and they pull in opposite directions.
A single reading above a number is not an exceedance. In our experience across UAE facilities, alerts configured on raw values generate enough traffic that teams begin dismissing them, which removes the system’s operational value. Equally, a parameter that never peaks dramatically can sit above an eight-hour average for extended periods without triggering anything at all.
Useful alerting therefore has to be configured on the same averaging windows the framework uses. The specific values should be confirmed against the current version of the guidelines for your building type, but the structure is the point: a threshold without a duration attached is not a rule the data can be tested against.
Three alert tiers, not one
- Informational. Trend drift within acceptable ranges. Reviewed monthly, no response required.
- Operational. A defined threshold sustained across its relevant window. Goes to the FM team with a response time attached.
- Escalation. A ceiling value, or a sustained breach across multiple windows. Goes to engineering, with the zone and the duration recorded.
Where we see deployments underused, the common configuration is a single tier set at a raw value and routed to everyone, which is functionally close to having none.
What each parameter should actually trigger
Sustained elevated CO2 indicates a ventilation rate that does not match actual occupancy, assessed against the minimum rates in ASHRAE Standard 62.1. The action is an engineering review of fresh air delivery to that zone, not a comfort adjustment.
Relative humidity sitting above the band for extended periods is a mold risk finding rather than a comfort one, and the response is assessment of the moisture mechanism. Our guidance on humidity imbalance across the building envelope covers why a dehumidifier rarely resolves it.
Particulate rising without a change in occupancy points to filtration performance or envelope ingress, which makes it a filter and ductwork question. This is where monitoring data and hvac air quality testing inform each other: the trend identifies the zone; the test establishes what is in the air.
For office air quality testing, complaints frequently concentrate in specific zones at specific times rather than building-wide, which is the case for acting on zone data rather than site averages.
Feeding the maintenance and budget cycle
This is where monitoring earns its cost, and where most programmes stop short.
Zone-level humidity and particulate history is scoping evidence. It identifies which zones justify a duct inspection this cycle and which do not, which is the difference between a priced programme and a site-wide assumption. Our Q4 duct hygiene checklist covers that verification step.
A pattern of recurring exceedances in one zone across a full season is also a capital case rather than a maintenance one. A zone that cannot hold its parameters under normal load has a design or capacity constraint, and twelve months of data is the argument for addressing it.
Continuous data does not replace accredited sampling. IAQ testing in Dubai remains the compliance instrument and the laboratory-grade source identification, as our comparison of snapshot and continuous approaches sets out.
What a deployment needs to produce decisions
- Alert windows matching the averaging periods in the applicable guidance
- A named owner for each alert tier, with a response time
- Zone-level reporting rather than building averages
- A monthly review against the previous period, not only a live view
- Retention long enough to establish a seasonal baseline
- A defined route from a recurring finding to a scoped intervention
Discuss a monitoring programme that produces decisions for your building.
Envida Environmental delivers IAQ monitoring and reporting using Sensgreen continuous sensors, alongside accredited indoor air quality testing in Dubai and building air quality testing across the UAE for commercial, hospitality, healthcare, and education facilities.
📞 +971 4 361 7949
📧 admin@envida.ae
Available 24/7 across Dubai and the UAE
Frequently Asked Questions
Why does our monitoring dashboard generate alerts nobody acts on?
Usually because alerts are set on raw readings rather than the averaging windows the guidance uses. Momentary spikes are not exceedances, so the traffic gets dismissed.
What should trigger escalation rather than a routine action?
A ceiling value, or a threshold sustained across multiple averaging windows. Both should be routed to engineering with the zone and duration recorded.
Does continuous monitoring replace accredited IAQ testing?
No. Testing remains the compliance instrument and provides laboratory-grade source identification. Monitoring provides the exposure history and the zone-level pattern.
How long before monitoring data is useful for budgeting?
A full cooling season is the practical minimum, because a zone’s behaviour under peak load is what a capital case has to demonstrate.
Should we monitor every zone or a selection?
A selection, prioritising zones with complaint history, poor air movement, or previous remediation. A site assessment should determine placement before deployment.
Can monitoring data support a duct cleaning scope?
Yes. Zone-level particulate and humidity history identifies which zones justify inspection this cycle, which produces a priced scope rather than a site-wide assumption.
